Who are the possession kings and what does it mean? Is possession everything.... who uses possession the best.... lets find out....
More opportunities with the ball in hand mean more chances at victory and this week we take a look at the most dominant teams in terms of overall possession, what they’ve done with it and how that has translated to results at the end of the day.
The match average per team for time in possession in the last decade of Super Rugby is 16 minutes and seven seconds, with a range of 21 minutes from the minimum to the maximum in that time.
The Reds hold top posting after dominating possession in their 19-13 defeat to the Chiefs in 2019. The Queensland side held the ball for 28 minutes and 39 seconds – nearly two full minutes more than any other team has managed in a game in the last decade of Super Rugby.
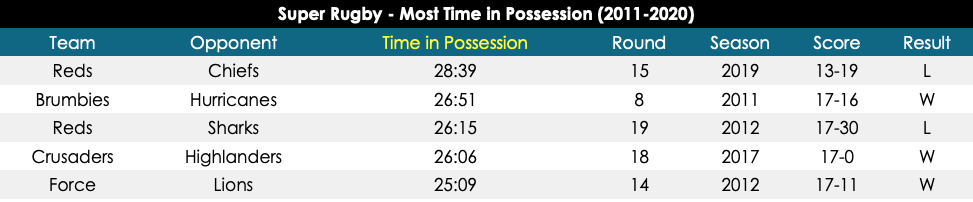
Australian teams make out the top three in this regard, with the Brumbies (2011) and Reds again (2012) finishing the podium ranks. However, of these three instances, the Brumbies’ one-point win against the Hurricanes in Round 8 of the 2011 season is the only game that saw the possession dominator win on the day.
Across the last five Super Rugby seasons, no team has commanded possession more on average than the Blues. The Auckland side have enjoyed 17 minutes and 11 seconds of time in possession of the ball per game in that stretch – but it has amounted to a win rate of just 42% in that period.
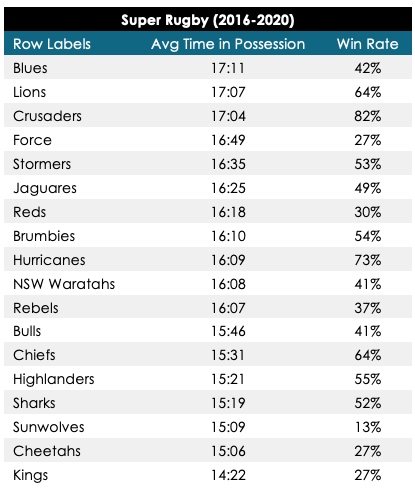
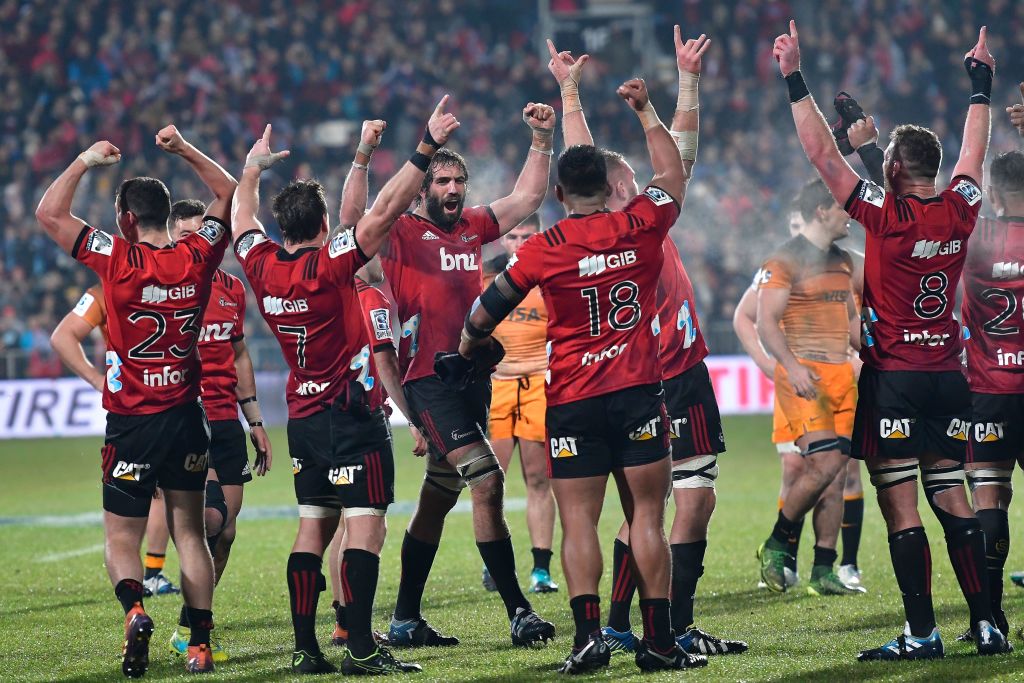
However, the next two sides – the Lions and Crusaders – are among the top sides in terms of win rates. The Crusaders (82%) [pictured below] are ranked first and the Lions (64%) third in this record, both doing so on the back of impressive possession metrics.
The Kings – who played only two seasons worth of games in this period – endured the lowest time in possession per game of any team in the last five Super Rugby seasons. At just 14 minutes and 22 seconds, they are the only team with fewer than 15 minutes of time in possession per game.
The Chiefs have the best win rate (64%) of any team with an average of fewer than 16 minutes time in possession per game across the last five Super Rugby campaigns. It’s easy to see why when we average out key data points per 10 minutes of time in possession in the same span.
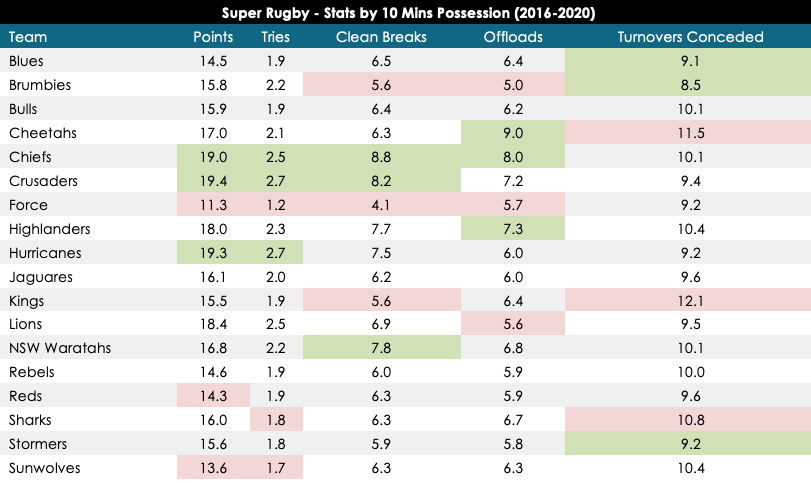
The Chiefs rank among the top three teams when it comes to points, tries, clean breaks and offloads made per 10 minutes of time in possession across the last five Super Rugby seasons – the only team to do so. Indeed, their 8.8 clean breaks per 10 minutes of time in possession in that period is more than any other team to have competed in Super Rugby in that time.
The Crusaders are also amongst the top three ranked teams in terms of points, tries and clean breaks made per 10 minutes of time in possession since the beginning of the 2016 campaign. No other team in the competition tops out in the first three in more than two categories among those included.
The Brumbies have posted as one of the enigmas of efficiency in recent years. Though they have struggled in relation to the rest of the competition in terms of clean breaks (5.6) and offloads (5) per 10 minutes of time in possession – ranking in the bottom three for both categories – they have been among the best to keep the ball within their grasp though. The Brumbies have conceded just 8.5 turnovers per 10 minutes in possession in the last five Super Rugby seasons, which is the fewest of any team in the competition.