With the Super Rugby competition concluded for 2018, it’s time to reflect on another season of stats and look at some key numbers that told the story of this year’s placings.
In comparison to last year’s competition, Super Rugby 2018 saw an increase in the average number of tries scored per match from 6.89 tries per match to 7.28 tries per match. There was also a marked improvement in the performance of teams who finished at the bottom of the ladder, with just two teams notching four wins or less in 2018 (Blues four wins, Sunwolves three wins) compared to the six teams from last season (Reds Waratahs Cheetahs Bulls four wins, Sunwolves two wins, Rebels one win).
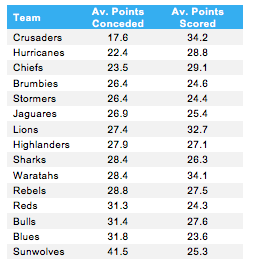
The Crusaders were clearly the stand-out team all year. They led the competition for average points scored per match (34.2), with the Waratahs (34.1) and Lions (32.7) close behind. But it was from a defensive standpoint where the Crusaders especially stood out, as they conceded just 17.6 points per match, nearly five points less than the competition’s second-best defensive side, the Hurricanes (22.4).
With Super Rugby games spanning across 4 continents, away wins were hard to come by even for the competition’s best. The Crusaders lost their first two away games, but then won their next six games away from Christchurch. Winning away from home proved difficult for a few other semi-finalist teams this year, the Lions and Hurricanes each winning just three of their eight away games.
The Sunwolves and the Bulls were the only teams who failed to win any away games, while curiously, the second-last placed Blues had 75% of their wins come from outside of Auckland (3 away wins, 1 home win).
There was a strong correlation between tries scored in the first quarter of the match and final position on the Super Rugby ladder. Three of the top four teams on the overall ladder were the most potent in attack in the first 20 minutes of the match (Crusaders 24 tries, Hurricanes 20 tries, Lions 18 tries).
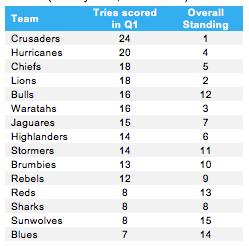
Conversely, the Reds (eight tries), Blues (seven tries) and Sunwolves (eight tries), who finished 13th, 14th and 15th respectively, struggled to get over the stripe in this period.
The Jaguares impressed in a number of areas this season, leading the competition for average time in possession (17:45), passes per games (176) and carries (129). However, they failed to make significant yardage with all their possession, sitting eighth for average metres gained (437).
The Waratahs led the field in average metres gained, unsurprisingly due to their superb winger Taqele Naiyaravoro. Naiyaravoro leading the competition for metres gained (1478m) and sitting second for clean breaks (42).
The Sharks and Chiefs missed the fewest tackles on average (20.6) while the Lions won the most turnovers (8.6) but were the most ill-disciplined side, conceding an average of 13 penalties per match. This resulted in the Lions conceding the most penalty goals this season (28) while kicking only 11 goals themselves, the fewest in the competition.